Part 4: Meta-model and model visualization
Visualizing the meta-model and model is useful for two main reasons. The first reason is debugging your parser. With an image, you can quickly spot if an AST node is missing or is not in the right place. With a step-by-step debugging tool, it might take longer to spot the mistake, even more so if the AST is deep. The second reason is to understand the structure of your AST or explain it to someone. Because it is often easier to understand something through an image than text. You can find many other reasons to visualize abstract entities, such as an AST.
Generating and saving the AST as PNG
To visually represent the AST, we will generate an image based on the model. The model acts as the input, while the image serves as the output. To save this image for future reference, we will need to specify a file path for storage.
flowchart LR
    A1(Input 1: Model)
    A2(Input 2: File path)
    B[Function]
    C(Result: Image stored in path)
    A1 & A2 --> B --> C
Before we can output an image, however, we need to convert the model into a DOT file.
What is a DOT file?
DOT is a graph description language that can then be converted into a PNG image using the pydot library. You can use the graph_from_dot_data function from pydot to generate a graph that can be saved as a PNG image. Finally, use the write_png method from the generated graph to create the PNG file.
The next question is: how do we obtain the DOT file?
Generating a PNG
Fortunately, textX provides a straightforward way to convert models and meta-models into a DOT file using the model_export_to_file function from textx.export. It is also possible to generate a DOT file for the meta-model using metamodel_export_tofile instead.
Putting together what has been said:
import io
from pydot import graph_from_dot_data
from textx.export import model_export_to_file

def write_png_from_model(model: textx.Model, filename: str) -> None:
    # Convert model to DOT format
    dot_file = io.StringIO()
    model_export_to_file(dot_file, model)

    # Generate graph from DOT data and save as PNG
    (graph,) = graph_from_dot_data(dot_file.getvalue())
    graph.write_png(f"{filename}.png")
The following is an example using the previously generated metamodel:
wff_example = "(~A&B)"
model_example = metamodel.model_from_str(wff_example)
write_png_from_model(model_example, "ast_image_example")
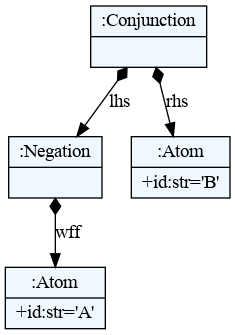
Which results in the following image:

Figure 1. Visualization of the model for the formula: ~A&B. This is how the model is represented. To access the leaf nodes, the program needs to traverse the object like a tree.
In part 5 we design and implement a method to transform the wff back into a string.